To begin with, I would like to pose a question: how often do you open the Nanjing University app to check your class schedule? Personally, I find waiting for the official app to load quite annoying.
However, I can now check my upcoming classes at a single glance on my desk.
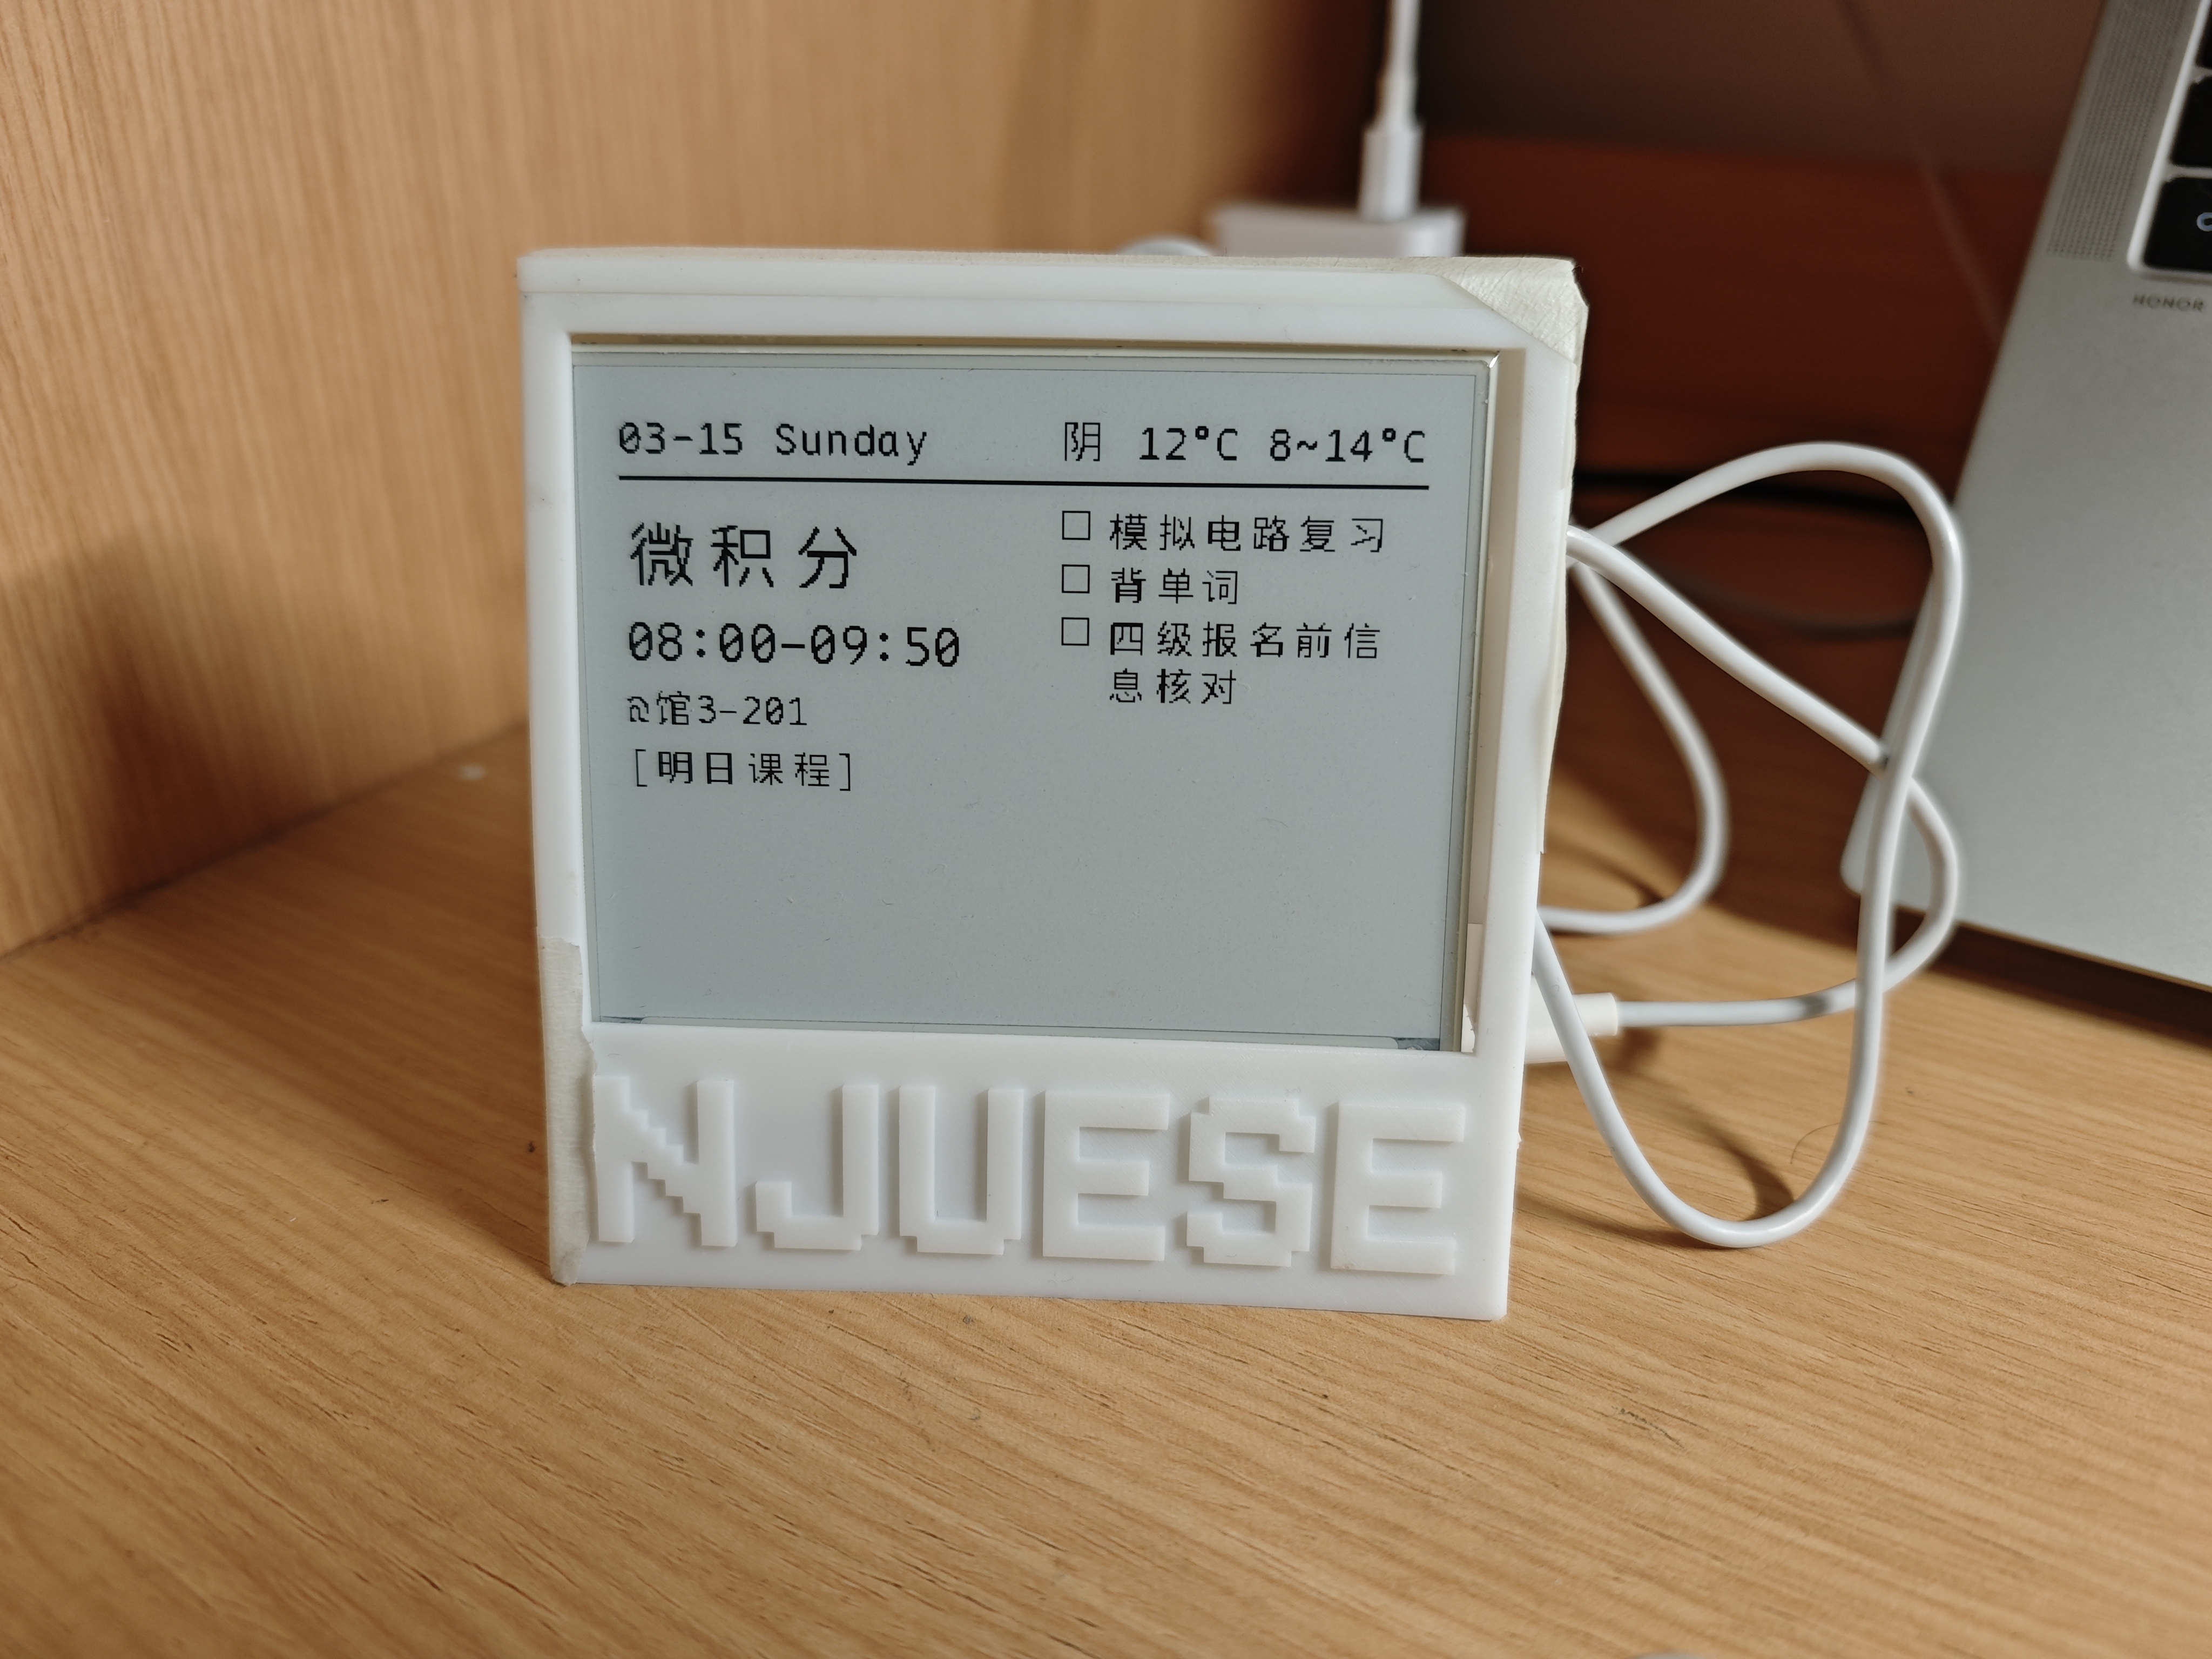
Yes, this is my custom Dashboard, which displays my daily class schedule.
I achieved this e-Paper Dashboard based on the ESP32 microcontroller. It not only displays the course timetable, but also shows my calendar events, the weather forecast, and a proverb from Nietzsche.
Let me walk you through its various functions.
Functions
As you can see on the screen, the display features the upcoming lesson, my to-do list, the date, and the weather. First, I would like to focus on the left section: the class schedule. As we all know, our class schedule varies from week to week, meaning a fixed timetable does not apply to us. This screen automatically highlights the exact upcoming class. Moreover, when it is time to rest—for instance, on weekends—it displays Nietzsche’s proverb: ‘Und verloren sei uns der Tag, wo nicht getanzt wurde.’ Second, the right section reveals my to-do list, which is synchronized seamlessly with my phone. Finally, the top section presents the current date and weather conditions.
Step by Step
Next, I want to share the whole story behind building this IoT hardware, and explain how I made this dashboard step by step.
Step 1: Initiation
Three weeks ago, while I was watching a video on Bilibili, a smart clock captured my attention and gave me the inspiration to create a dashboard for myself. I conceived of a device capable of demonstrating all the vital information I need to acquire in the morning, such as the timetable, weather, to-do list, and date. However, little did I know that it would be such a challenging project for a freshman who is not experienced in Python and Android development.
Step 2: Developing and Vibe Coding
There are too many technical details in this project to cover thoroughly, so I have selected the most crucial and fascinating aspects: the system structure and “vibe coding.”
This picture illustrates the overall structure of my project.
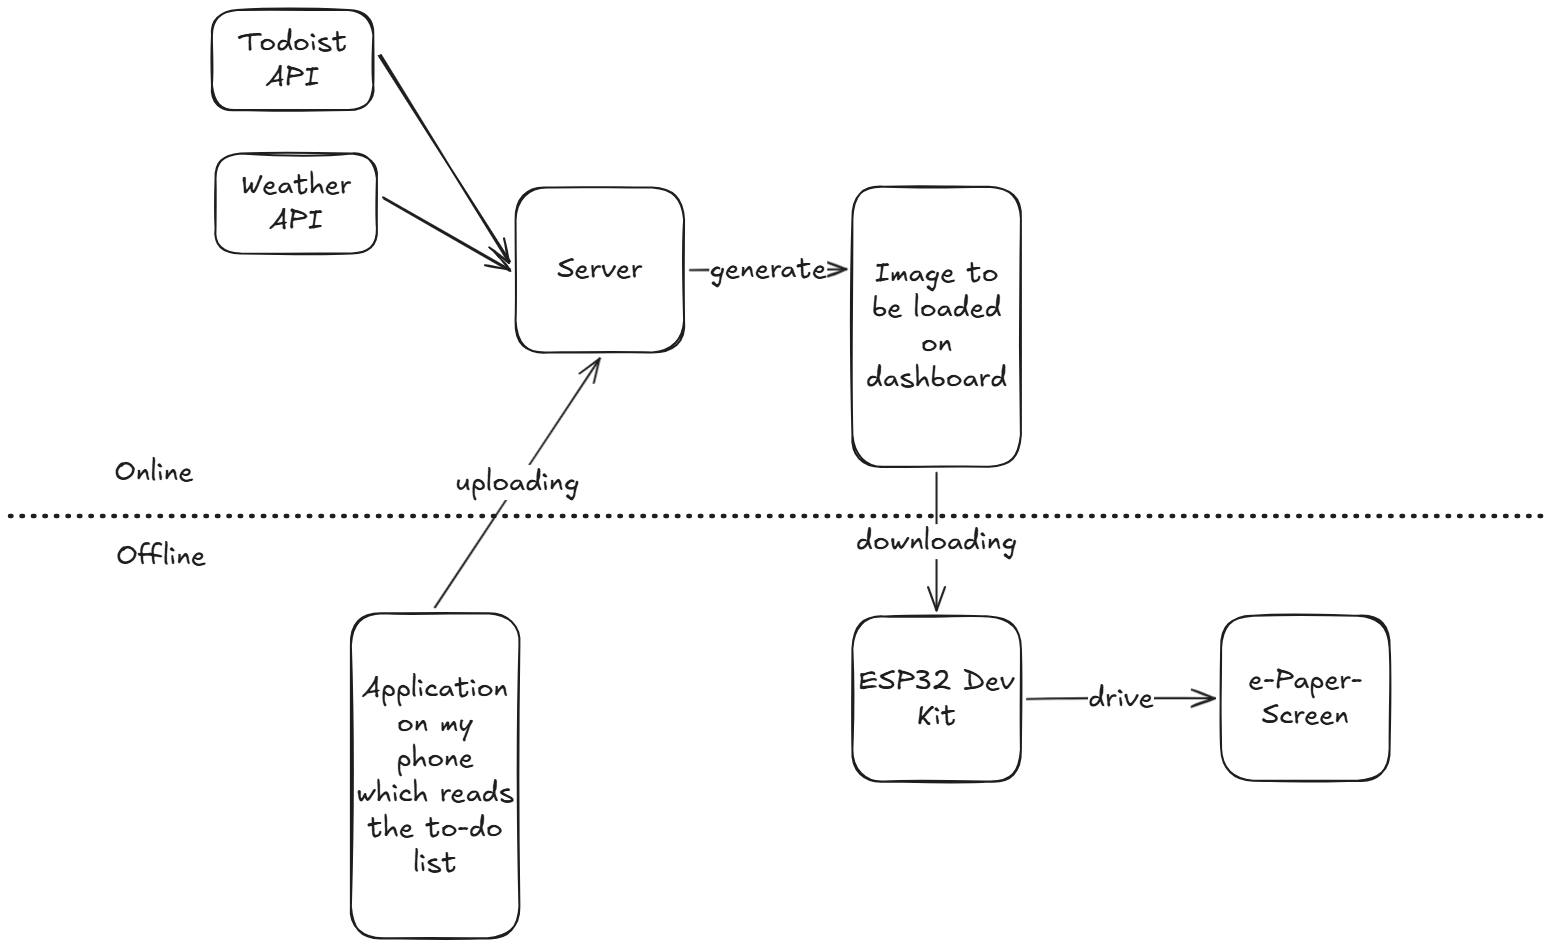
As the chart demonstrates, the server receives a range of data—including weather forecasts and to-dos—from an Android application written entirely by an LLM. It then renders the image for the dashboard using a Python program, which was also developed with the assistance of an LLM.
Step 3: Add an Enclosure
I designed a customized box for it. The engraving “NJUESE” stands for the department I belong to—the School of Electronic Science and Engineering at Nanjing University. Afterwards, I 3D-printed the enclosure.
I am absolutely certain that had I not utilized an LLM as a tool, I could not have achieved this project. I know many of us, myself included, are worried about being replaced by AI in the future. However, certain tedious tasks ought to be replaced as technology keeps evolving. Perhaps we no longer need to bother reading the long and tedious Todoist API manual just to learn how to fetch server data—which happened to be a critical sector in my Python program.
Nowadays, I am used to checking it daily for my classes and upcoming events. Even though this dashboard might not be a project built entirely by “myself,” it works perfectly.